
52 year old female with ESRD is transferred from an outside hospital for “possible sepsis.” Patient is somnolent in bed, vitals are BP 75/60, HR 62, RR 24, Temp 98.6. Your medical student on his ultrasound rotation does an echo, sees a pericardial effusion and is concerned for tamponade. What findings do you point out to him that are suggestive of tamponade?

Pericardial Tamponade
- Pericardial effusion large enough to create pressures exceeding filling pressures in cardiac chambers.
- Patients with chronic effusions can accommodate large volumes before tamponade. This patient had ~1000mL drained on pericardiocentesis. Acute pericardial effusions can cause tamponade physiology at as low as 50-100mL.1
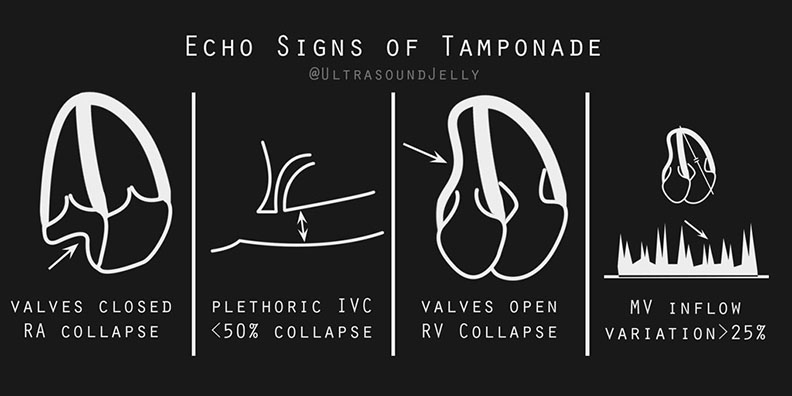
Key Findings:
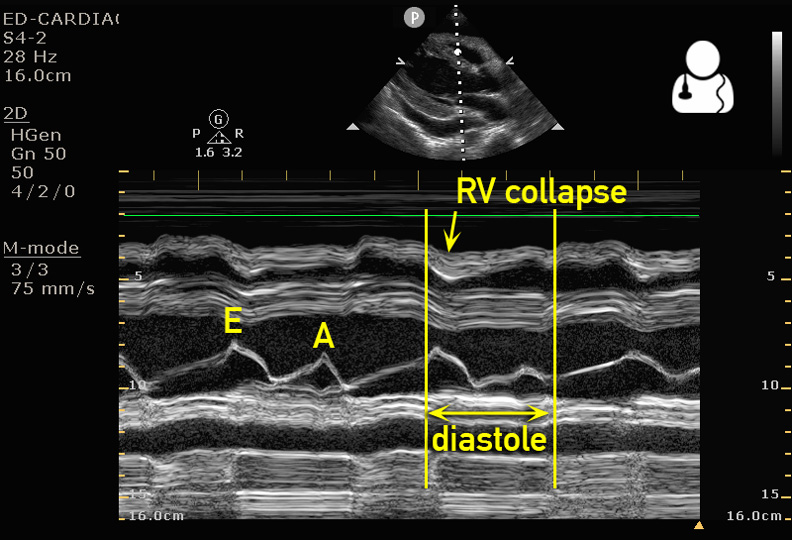
- Right ventricular diastolic collapse: seen as free wall of ventricle denting inward while filling. Commonly referred to as the “little man bouncing on a trampoline.”
- If you see collapse of the free wall, examine this ventricular wall by pausing video when mitral/tricuspid valve is open to ensure you are visualizing diastolic and not systolic collapse.
- M-mode may be used in parasternal long axis to demonstrate RVOT dipping in conjunction with the E wave.
- Right atrial systolic collapse: visualized inward denting when tricuspid valve is closed
- RA has lowest filling pressure making it the earliest affected and most sensitive finding.1
- The apical cardiac view often gives the best view of the right atrium for assessment of collapse:
- IVC: A patient with tamponade will have a plethoric IVC with minimal respiratory variation.
- An IVC with respiratory-phasic changes (>50% collapse with deep breath) suggests a low CVP and rules out tamponade physiology with a 97% sensitivity.2
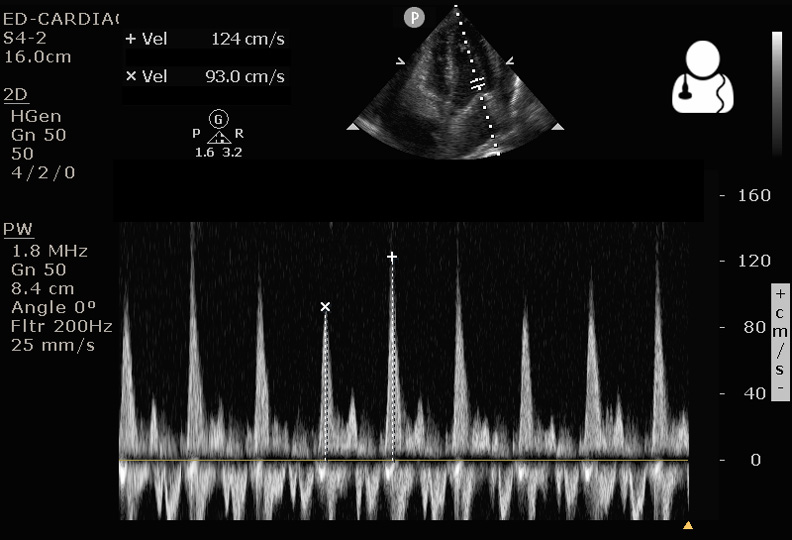
- Mitral/tricuspid inflow velocity variation with respiration: respiratory-phasic changes in mitral inflow velocity is
 sensitive for tamponade physiology, and is the echo equivalent of pulsus paradoxus.
- Obtain apical view of the heart, place the pulse wave marker just past the tip of the mitral leaflets (see diagram), then hit the pulse wave button.
- The image produced plots the velocity of blood flow vs time. The inflow velocities are above the baseline, where you will typically see an E spike and an A spike.
- The largest and smallest E spikes should be measured, corresponding to mitral inflow during inspiration and expiration. A variation of >25% in the mitral or >40% in the tricuspid inflow velocity supports a diagnosis of tamponade physiology.1
In this patient, tamponade was rapidly identified at the bedside. As IVF boluses were instituted, cardiology was consulted for emergent pericardial drainage. The patient was taken to the cardiac cath lab where an pericardial drain was placed under fluoroscopy.
For a great short video walking you through ultrasound evaluation of pericardial tamponade, check out this 5 Minute Sono tutorial.
- Otto, Catherine M. Textbook of clinical echocardiography. 5th ed. Philadelphia, PA: Elsevier/Saunders, 2013. Print.
- Himelman RB, Kircher B, Rockey DC, Schiller NB. Inferior vena cava plethora with blunted respiratory response: a sensitive echocardiographic sign of cardiac tamponade. J Am Coll Cardiol 1988;12: 1470–7.
